Diagrams are a great means for us to connect with information and process its significance; they help in communicating relationships and abstract information and enable us to visualize concepts.
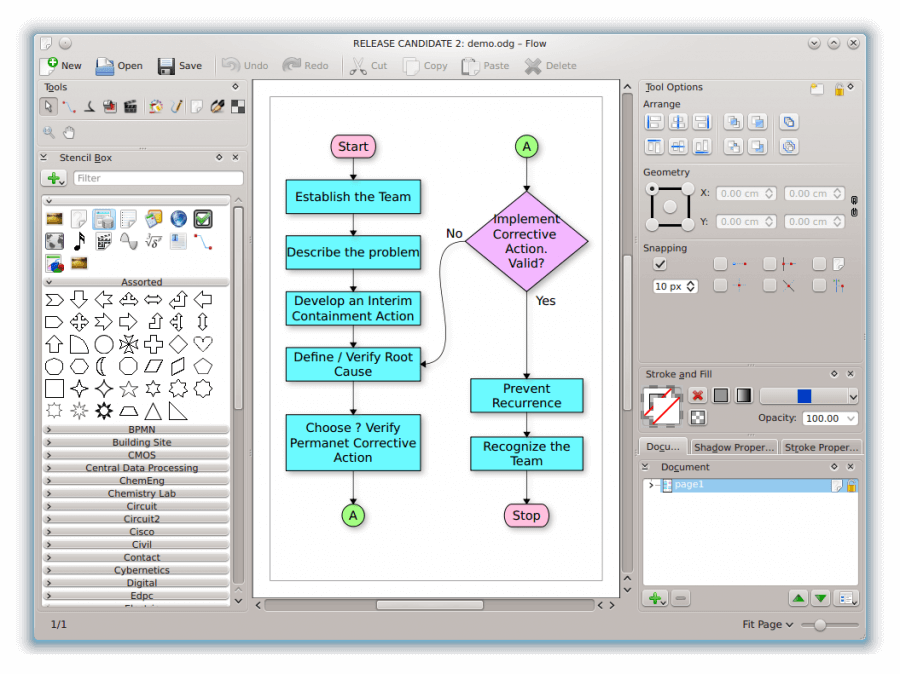
The flowchart and diagramming tools are used for everything from basic workflow diagrams to complex network diagrams, organization charts, BPMN (Business Process Model and Notation), UML diagrams and much more.
Are you looking for free and open-source flowchart and diagramming software to create different kinds of diagrams, flowcharts, illustrations, maps, web graphics and more, on a Linux desktop? This article reviews 10 best flowcharts and diagramming software for Linux.
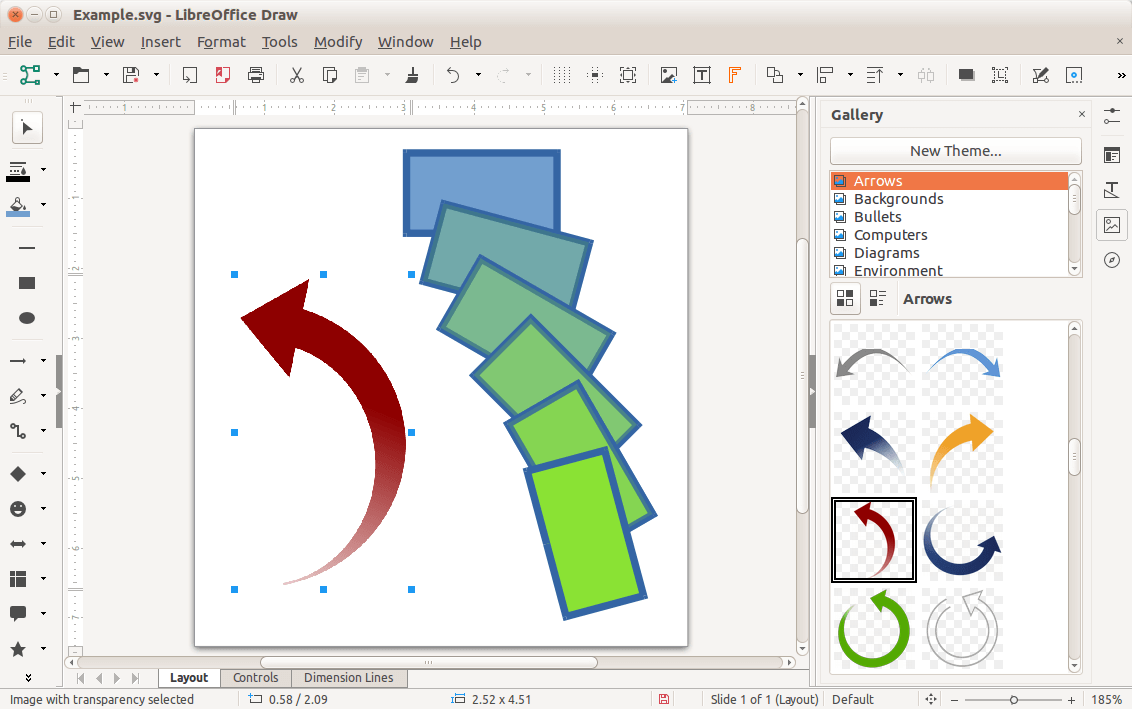
1. LibreOffice Draw
The Draw is a feature-rich, extensible, easy-to-use, and an excellent tool for producing powerful and intuitive flowcharts, organization charts, network diagrams and many other types of graphics. It is also used to manipulate pictures and images in so many ways, and it can produce anything from a quick sketch to complicated figures.
A draw is a part of LibreOffice, a powerful and free office suite that runs on Linux, macOS and Windows machines. It uses the Open Document Format for Office Applications (ODF) (.odg graphics extension).
Some of its features include a gallery of shapes and drawings, a spellchecker, hyphenation mode, and color replacing. Importantly, it supports importing, editing, exporting PDFs, importing from several file formats and exporting to GIF, JPEG, PNG, SVG, WMF, and more.
Also, it supports macro execution with Java, various extensions and its filter settings can be configured using XML.
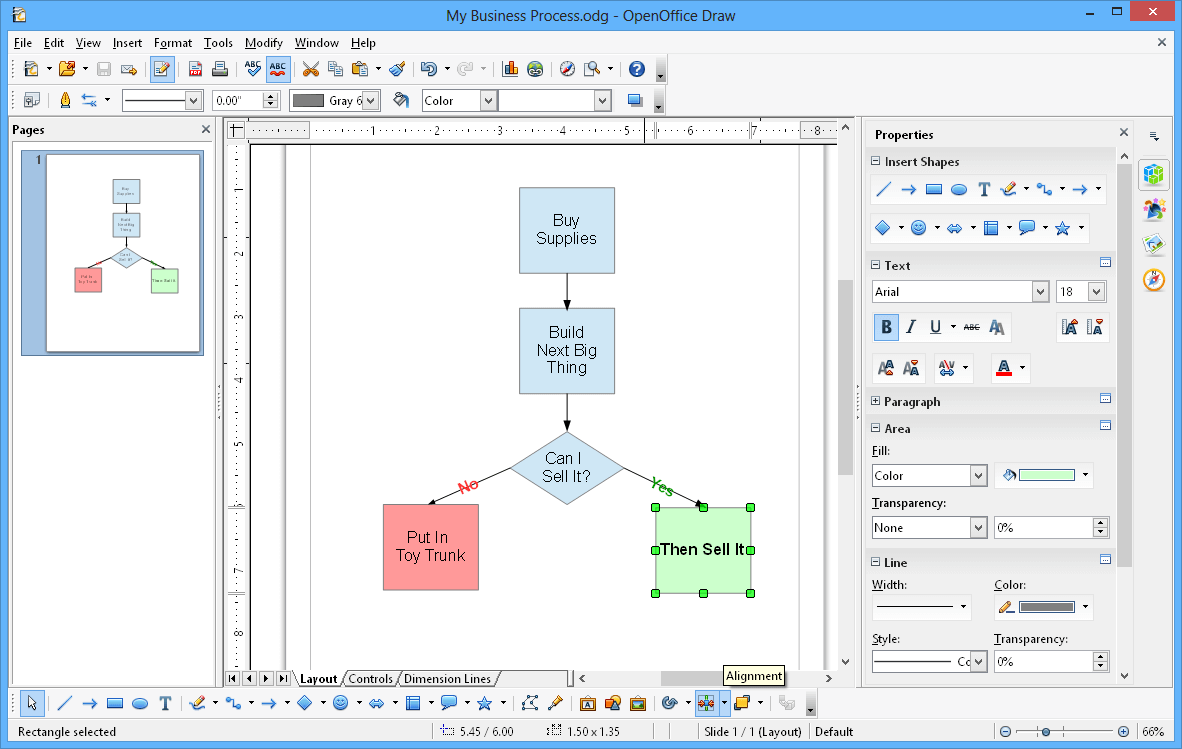
2. Apache OpenOffice Draw
OpenOffice Draw is a free application for drawing business processes and diagrams. It is one of the tools included in the Apache OpenOffice office suite. Similar in functionality to LibreOffice Draw, it supports different diagram types such as flowcharts, organization charts, network diagrams, etc.
It also supports various styles and formatting, allows you to import and export graphics from and to all common formats (including BMP, GIF, JPEG, PNG, TIFF, and WMF). Support for creating flash (.swf) versions of your work is also available.
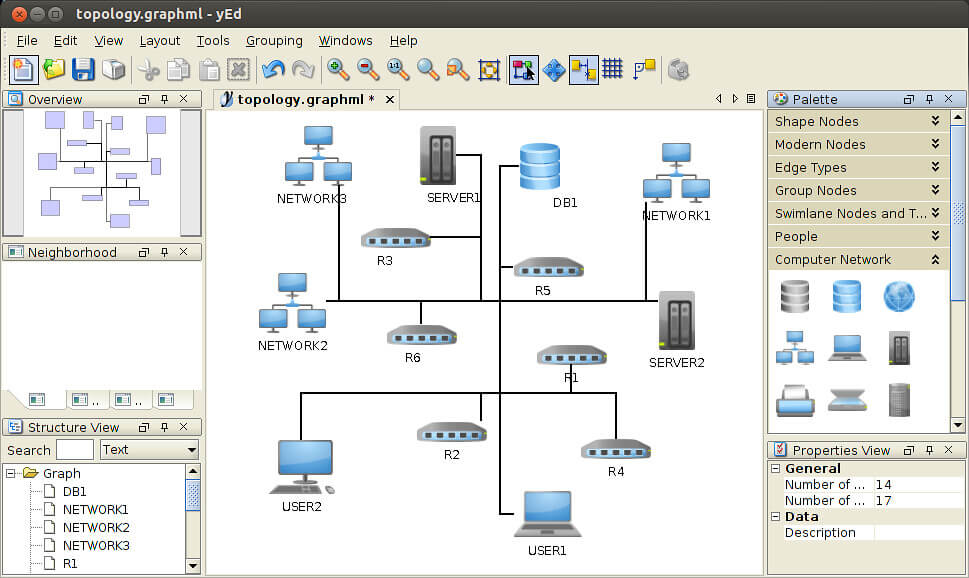
3. yED Graph Editor
yEd Graph Editor is a free, powerful and cross-platform desktop application used for quickly and effectively creating diagrams. It runs on all major platforms such as Unix/Linux, Windows, and Mac OS X. yEd supports a wide variety of diagram types allowing you to create diagrams manually or import external data for manipulation or analysis.
It supports diagrams such as illustrated types, organization charts, mind maps, swimlane diagrams, ERDs, and many more. Its key features include an intuitive user interface, support for importing external data from an Excel spreadsheet (.xls) or XML, automatic arrangement of diagram elements, and exporting of bitmap and vector graphics such as PNG, JPG, SVG, PDF, and SWF.
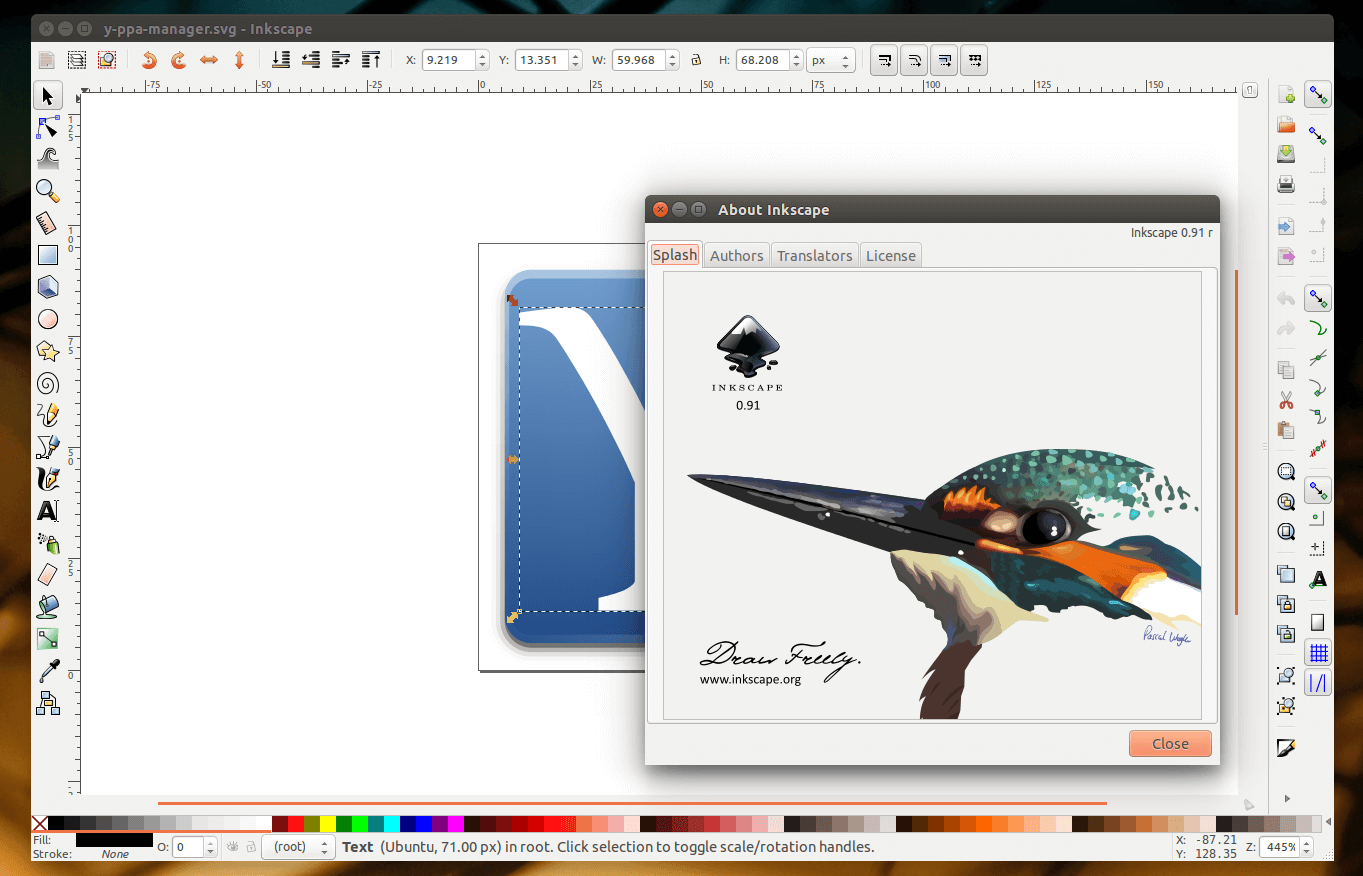
4. Inkscape
Inkscape is a free and open-source, cross-platform vector graphics software with a simple interface, which runs on GNU/Linux, Windows, and Mac OS X. It is multi-lingual and highly customizable. You can use it to create a wide range of graphics such as flowcharts, illustrations, icons, logos, diagrams, maps, and web graphics.
It features object creation and manipulation, fills and stroke, text operations, rendering, and more. It uses the W3C open standard SVG (Scalable Vector Graphics) as its native format. With Inkscape, you can import and export to various file formats, including SVG, AI, EPS, PDF, PS, and PNG. You can also extend its native functionality using add-ons.
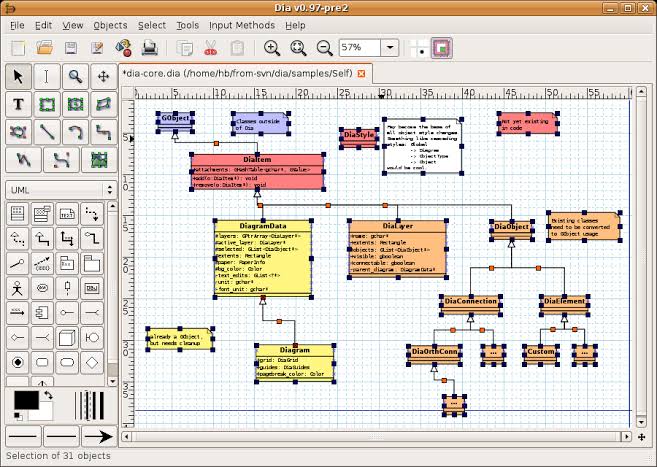
5. Dia Diagram Editor
Dia is a free, open-source, easy-to-use popular and cross-platform drawing software for Linux desktops. It also runs on Windows and Mac OS X. It is used to create more than 30 different diagram types including flowcharts, network layouts, database models. Dia features more than 1000 predefined objects and symbols and supports many import and export formats. For programmers, it is scriptable via Python.
6. Calligra Flow
Calligra Flow is an easy to use tool for creating diagrams and flowcharts. It is included in Calligra Office Suite and is highly integrated with the other Calligra applications. It supports various diagram types such as network diagrams, organization charts, flowcharts and more.
7. Graphviz
Graphviz (Graph Visualization Software) is an open-source and programmable graph drawing software. It ships in with a collection of programs for graph visualization specified in DOT language scripts. Besides, it has web and interactive graphical interfaces, and auxiliary tools, libraries, and language bindings.
Graphviz is used to generate diagrams either manually or from external data sources, in several useful formats including images and SVG for web pages, and Postscript for inclusion in PDF. You can also display output in an interactive graph browser.
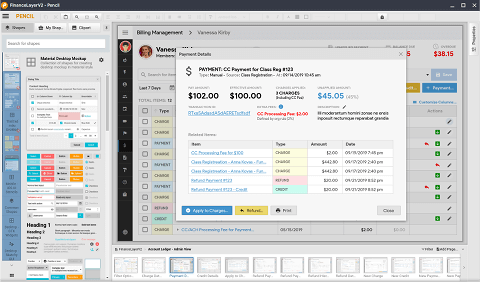
8. Pencil
Pencil is a free and open-source, easy to use tool for GUI (Graphical User Interface) prototyping, used to create mockups in popular desktop environments. It comes with numerous built-in shapes collection (including general-purpose shapes, flowchart elements, desktop/web UI shapes, Android and iOS GUI shapes) for drawing different types of user interface ranging from desktop to mobile platforms.
The pencil also supports diagram drawing, exporting to different output formats including OpenOffice/LibreOffice text documents, Inkscape SVG and Adobe PDF, and inter-page linking. In addition, it integrates with OpenClipart.org allowing you to easily find Cliparts from the Internet.
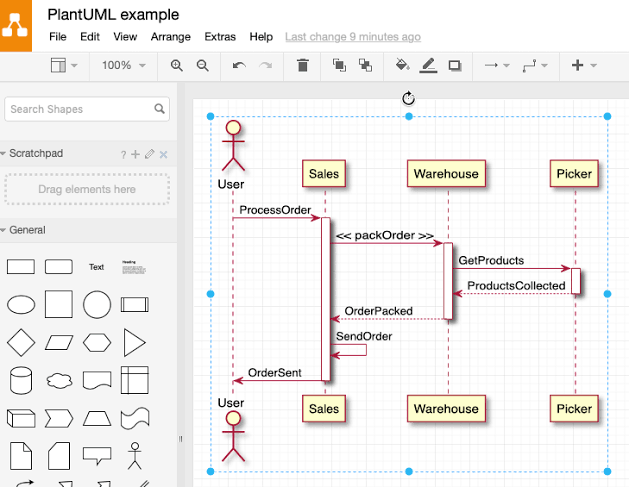
9. PlantUML
PlantUML is an open-source tool for generating UML diagrams using a simple textual description language. It is used for modeling, documentation, and UML. It enables you to create nice professional-looking diagrams and technical designs. PlantUML has an intuitive syntax and is command-line based, and can be used in combination in GNU Emacs org-mode for writing technical documentation.
It supports UML diagrams such as class diagram, sequence diagram, collaboration diagram, use case diagram, state diagram, activity diagram, component diagram, deployment diagram, and entity relationship diagram.
You can also use it to create non-UML diagrams such as Wireframe graphical interface, archimate diagram, Specification and Description Language (SDL), ditaa diagram, gantt diagram, and many others. Furthermore, you can export output to PNG, in SVG or in LaTeX format.
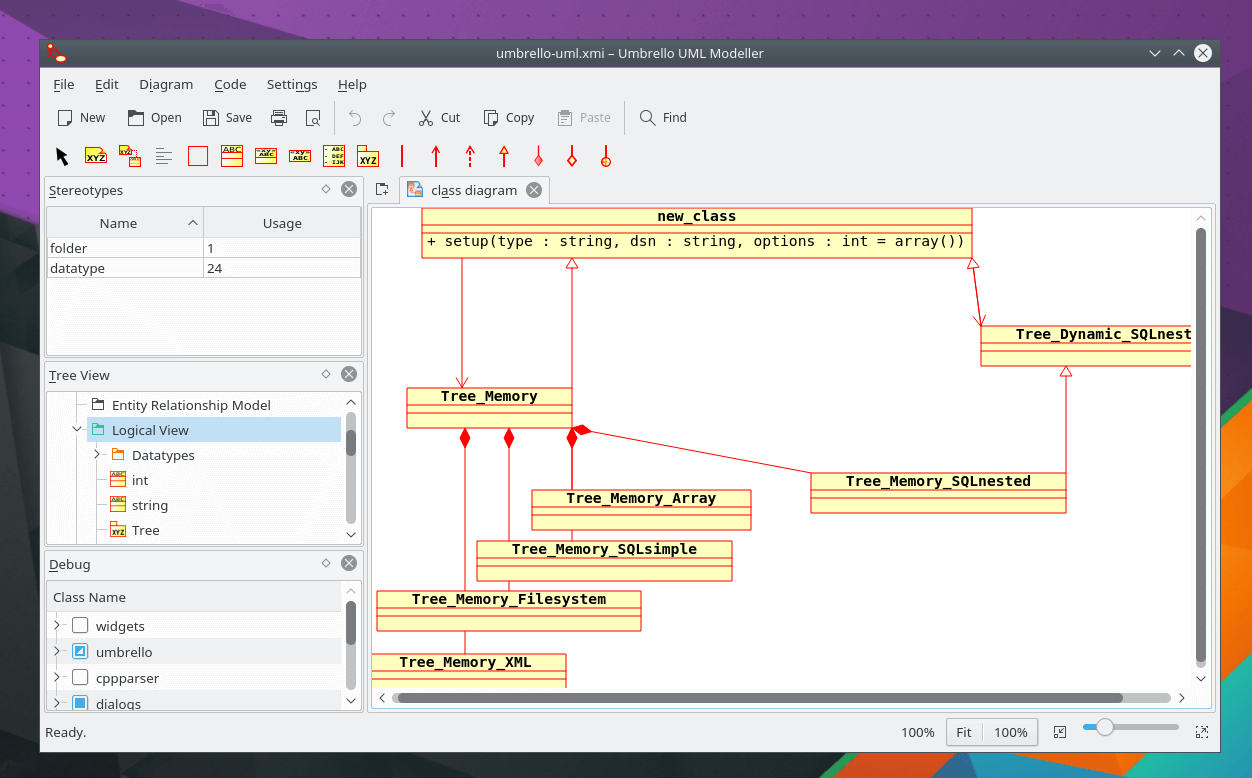
10. Umbrello
Last but not least, we have Umbrello UML Modeller, a free, open-source and cross-platform Unified Modelling Language (UML) diagram tool based on KDE, that runs on Linux systems, Windows and Mac OS X. It supports you in producing diagrams for designing and system documentation.
The Umbrello UML Modeller 2.11 supports different kinds of diagram types such as a class diagram, sequence diagram, collaboration diagram, use case diagram, state diagram, activity diagram, component diagram, deployment diagram, and ERDs.
That’s all we had for you! In this article, we shared the 10 best flowcharts and diagramming software for Linux. We would like to hear from you via the feedback form below.


Creately should be in the list. It has collaboration featured like Video, Real-Time Mouse Tracking and much more exciting options. Desktop version available for Linux.
The PlantUML example shows a graphical editor but after installing PlantUML I can’t find such editor other than external tools. What tools are actually being showcased here?
Where do you get them?
Calligra Flow is no longer contained in the suite and hasn’t been updated for two years. If you have to post articles that are just compiling information from other articles (and not mentioning those sources), how about at least checking if that information is still true?